And how significant of a downtrend?
View attachment 129037
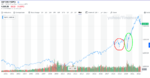
A look at this chart does not seem comforting.
Red circle is 2018...the market responding to the Fed hiking interest rates"too fast".
Green circle the COVID dip.
For much of the time after the green everyone was staying home, productivity was down, businesses were closed. People stopped paying rent. Stimulus checks were mailed.
And meanwhile stocks went soaring and everyone was an investing pro on Robinhood.
Stocks rallied because... a bunch of extra cash on hand to fuel a casino style environment?
So going by the market's negative response to a Fed rate hike in 2018 and the economic negatives that came along with COVID and coming out of COVID...what now when all the economic data is bad, bad, bad?
And listen to the Fed over the past year...No inflation > transient inflation > yeah, inflation is bad > negative GDP is perfectly fine!
Fed says this is a great economy for workers...WTF????? Wage workers are getting KILLED by inflation. If you work for wages you absolutely know this.
You can't trust them. They're clearly being deliberately dishonest.
People saying they're contributing to their 401K at a discount right now really cannot be looking at the big picture or are in complete denial. There is no discount when items are massively overpriced. It's pretty clear we are still in the midst of a massive bubble that is waiting to pop.